
桥水雄文——How the economic machine works 经济机器是如何运作的(五)
如没有时间阅读如此深入的文章,可点击以下链接收看时长为30分钟的,由雷达里奥个人配音完成的《经济机器是如何运行的》讲解视频。
3) The Short-Term Debt Cycle
短期债务周期
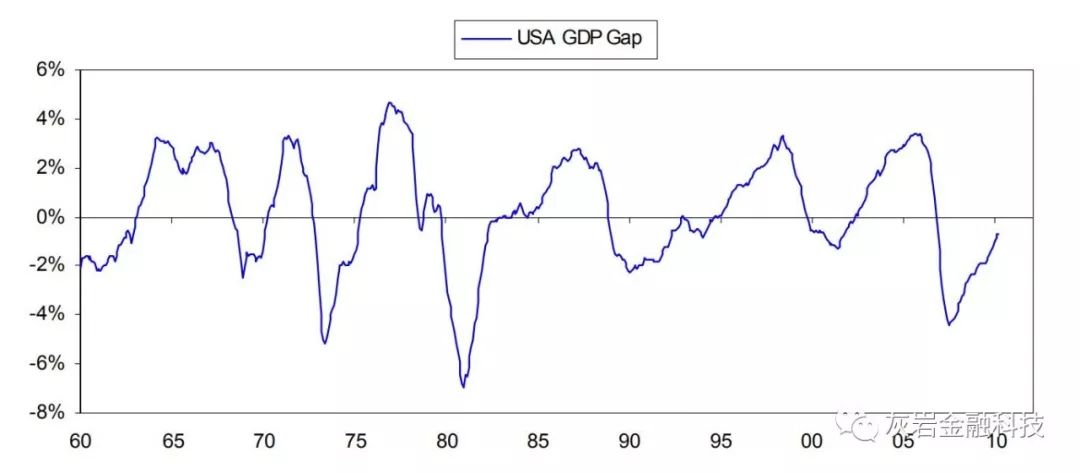
The short-term debt cycle, also known as the business cycle, is primarily controlled by central banks’ policies that a) tighten when inflation is too high and/or rising uncomfortably because there isn’t much slack in the economy (as reflected in the GDP gap, capacity utilization and the unemployment rate) and credit growth is strong; and b) ease when the reverse conditions exist. The cycles in the U.S. since 1960 are shown below.
短期债务周期,也称为商业周期,主要受到央行政策的控制:a)当通货膨胀过高和/或不舒服地上涨时收紧,因为经济没有太多松懈(如 GDP差距,产能利用率和失业率)和信贷增长强劲; 和b)当存在相反的条件时容易。 自1960年以来美国的周期如下所示。
These cycles can be described a bit differently by different people, but they are all about the same. They typically occur in six phases – four in the expansion and two in the recession.
不同的人可以用不同的方式描述这些周期,但它们大致相同。 它们通常分六个阶段发生 - 扩张中有四个阶段,经济衰退中有两个阶段。
The expansion phase of the cycle:
周期的扩展阶段:
The “early-cycle” (which typically lasts about five or six quarters), typically begins with the demand for interest rate sensitive items (e.g., housing and cars) and retail sales picking up because of low interest rates and lots of available credit. It is also supported by prior inventory liquidations stopping and inventory rebuilding starting. This increased demand and rising production pulls the average workweek and then employment up. Credit growth is typically fast, economic growth is strong (i.e., in excess of 4%), inflation is low, growth in consumption is strong, the rate of inventory accumulation is increasing, the U.S. stock market is typically the best investment (because there is fast growth and interest rates aren’t rising because inflation isn’t rising) and inflation-hedge assets and commodities are the worst-performing assets.
“早期周期”(通常持续约五或六个季度)通常始于对利率敏感项目(例如住房和汽车)的需求以及零售销售因低利率和大量可用信贷而增加。 先前的库存清算停止和库存重建开始也支持它。 需求的增加和产量的增加拉动了平均每周工作时间和就业率。 信贷增长通常很快,经济增长强劲(即超过4%),通胀率低,消费增长强劲,库存积累率增加,美国股市通常是最佳投资(因为那里) 增长迅速,利率没有上升,因为通胀没有上升)和通胀对冲资产和大宗商品是表现最差的资产。
This is typically followed by what I call the “mid-cycle” (which lasts an average of three or four quarters) when economic growth slows substantially (i.e., to around 2%), inflation remains low, growth in consumption slows, the rate of inventory accumulation declines, interest rates dip, the stock market rate of increase tapers off, and the rate of decline in inflation-hedge assets slows.
当经济增长大幅放缓(即降至2%左右),通胀率保持低位,消费增长放缓,利率下降时,通常会出现我称之为“中期周期”(平均持续三到四个季度)的情况。 库存积累下降,利率下降,股市增长率逐渐减少,通胀对冲资产下降速度放缓。
This in turn is followed by the “late-cycle“ (which typically begins about two and a half years into expansion, depending on how much slack existed in the economy at the last recession’s trough). At this point, economic growth picks up to a moderate pace (i.e., around 3.5-4%), capacity constraints emerge, but credit and demand growth are still strong. So, inflation begins to trend higher, growth in consumption rises, inventories typically pick up, interest rates rise, the stock market stages its last advance and inflation-hedge assets become the best-performing investments.
接下来是“后期周期”(通常在两年半后开始扩张,这取决于经济在上一次衰退的低谷时存在多少松懈)。 此时,经济增长速度缓慢(即约3.5-4%),产能限制出现,但信贷和需求增长仍然强劲。 因此,通胀开始趋势走高,消费增长,库存通常增加,利率上升,股市最后一步上涨,通胀对冲资产成为表现最佳的投资。
This is typically followed by the tightening phase of the expansion. In this phase, actual or anticipated acceleration of inflation prompts the Fed to turn restrictive, which shows up in reduced liquidity, interest rates rising and the yield curve flattening or inverting. This, in turn, causes money supply and credit growth to fall and the stock market to decline before the economy turns down.
通常紧接着是扩张的紧缩阶段。 在这个阶段,实际或预期的通货膨胀加速促使美联储转向限制,这表现在流动性减少,利率上升和收益率曲线趋于平缓或反转。 反过来,这导致货币供应和信贷增长下降,股市在经济衰退之前下降。
The recession phase of the cycle follows and occurs in two parts.
循环的衰退阶段紧随其后并分为两部分。
In the early part of the recession, the economy contracts, slack returns (as measured by the GDP gap, capacity utilization and the unemployment rate), stocks, commodities and inflation-hedge assets fall and inflation declines because the Fed remains tight.
在经济衰退的早期阶段,经济收缩,回报疲软(以GDP差距,产能利用率和失业率衡量),股票,商品和通胀对冲资产下跌,通胀下降,因为美联储仍然紧张。
In the late part of the recession, the central bank eases monetary policy as inflation concerns subside and recession concerns grow. So interest rates decline and the lower interest rates cause stock prices to rise (even though the economy hasn’t yet turned up) while commodity prices and inflation-hedge assets continue to be weak. The lower interest rates and higher stock prices set the stage for the expansion part of the cycle to begin.
在经济衰退的后期,央行放松货币政策,因为通胀担忧消退,经济衰退担忧加剧。 因此,利率下降,利率下降导致股价上涨(即使经济尚未出现),而商品价格和通胀对冲资产继续疲软。 较低的利率和较高的股票价格为周期的扩张部分开始奠定了基础。
Although I have referred to average time lags between each of these stages of the cycle, as mentioned from the outset, it is the sequence of events, not the specific timeline, which is important to keep an eye on. For example, given the previously described linkages, inflation doesn't normally heat up until the slack in the economy is largely eliminated, and the Fed doesn't normally turn restrictive until inflation rises. An expansion that starts off after a deep recession (i.e., one that produces lots of slack) is bound to last longer than an expansion that begins with less excess capacity. Similarly, as the cycle progresses through its various stages as a function of the sequences just described, the rate at which it progresses will be a function of the forcefulness of the influences that drive its progression. For example, an expansion that is accompanied by an aggressively stimulative central bank is likely to be stronger and evolve more quickly than one that is accompanied by a less stimulative monetary policy. Also, exogenous influences such as China’s entry into the world economy, wars and natural disasters can alter the progressions of these cycles. What I am providing is a description of the classic template: not all cycles manifest precisely as described.
For the sake of brevity, I won’t go into great depth about short-term debt cycles here.
虽然我已经提到了周期的每个阶段之间的平均时间滞后,如从一开始所提到的,但事件的顺序,而不是具体的时间线,这对于密切关注是很重要的。例如,鉴于之前描述的联系,通货膨胀通常不会升温,直到经济的疲软基本消除,而美联储通常不会在通胀上升之前转为限制。在经济深度衰退(即产生大量闲置的经济衰退)之后开始的扩张必将持续的时间长于以较少产能过剩开始的扩张。类似地,随着循环通过其各个阶段作为刚刚描述的序列的函数而进展,其进展的速率将是驱动其进展的影响的有力性的函数。例如,伴随着积极刺激的中央银行的扩张可能会比那些伴随着不那么刺激的货币政策的扩张更加强大和发展。此外,中国加入世界经济,战争和自然灾害等外生影响可以改变这些周期的进展。我提供的是对经典模板的描述:并非所有循环都如所描述的那样精确地表现出来。
为简洁起见,我不会深入探讨这里的短期债务周期。
The Interaction of These Three Forces
这三种力量的相互作用
While the economy is more complicated than this Template suggests, laying the short-term debt cycle on top of the long-term debt cycle and then laying them both on top of the productivity line gives a good conceptual roadmap for understanding the market-based system and seeing both where the economy is now and where it is probably headed. For the sake of brevity, I won’t digress into a complete explanation of this. But I will give an example.
虽然经济比这个模板所表明的更为复杂,但将短期债务周期置于长期债务周期之上,然后将它们置于生产力线之上,这为理解基于市场的系统提供了一个良好的概念路线图。 并看到现在的经济状况和可能的经济状况。 为简洁起见,我不会对此作出完整的解释。 但我会举一个例子。
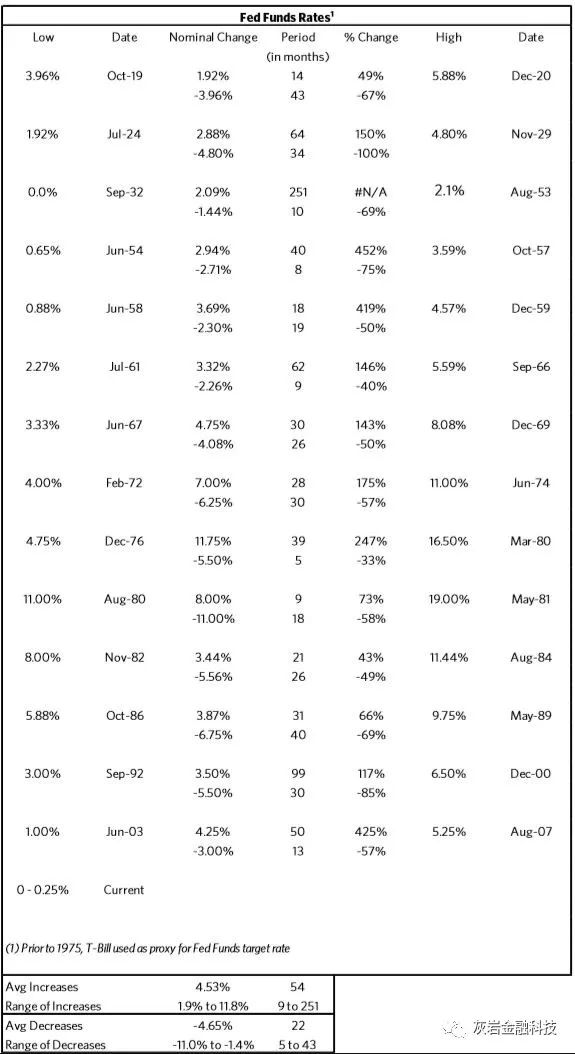
Example: The table below shows each of the cyclical peaks and troughs in the Fed funds rate, when they occurred, the magnitudes of changes up and the magnitudes of the changes down (in both basis point terms and percentage terms), since 1919. These are the interest rate changes that caused all of the recessions and expansions over the last 90 years. This table shows 15 cyclical increases and 15 cyclical decreases. Note that these swings were around one big uptrend and one big downtrend. Specifically, note that from the September 1932 low (at 0%) until the May 1981 high (at 19%), every cyclical low in interest rates was above the prior cyclical low and every cyclical high was above the prior cyclical high – i.e., all of the cyclical increases and decreases were around that 50-year uptrend. And note that from the May 1981 high in the Fed funds rate (at 19%), until the March 2009 low in the Fed funds rate (0%), every cyclical low in the Fed funds rate was lower than the prior low and every cyclical high in interest rates was below the prior cyclical high – i.e., all of the cyclical increases and all of the cyclical decreases were around a 27-year downtrend. Each cyclical decline in interest rates incrementally reduced debt service payments, lowered the de-facto purchase prices of items bought on credit to make them more affordable and boosted the value of assets a notch (having a positive wealth effect). So, debt continued to rise relative to income and money, though the trend in debt service payments was essentially flat, until interest rates hit 0% and this could not longer continue, at which time the government had to print and spend a lot of money to make up for the reduced private sector credit creation and spending.
示例:下表显示自1919年以来联邦基金利率中的每一个周期性高峰和低谷,发生变化的幅度以及变化的幅度(以基点和百分比表示)。是导致过去90年来所有经济衰退和扩张的利率变化。该表显示15次周期性增加和15次周期性减少。请注意,这些波动是一个大的上升趋势和一个大的下降趋势。具体而言,请注意,从1932年9月的低点(0%)到1981年5月的高点(19%),每个周期性低利率都高于先前的周期性低点,并且每个周期性高点都高于之前的周期性高点 - 即所有周期性增加和减少都在50年左右的上升趋势附近。并且注意到从1981年5月联邦基金利率的高位(19%),到2009年3月联邦基金利率的低点(0%),联邦基金利率的每个周期性低点都低于之前的低点和每个周期性高利率低于先前的周期性高点 - 即所有周期性增长和所有周期性下跌都在27年左右的下行趋势。每次周期性的利率下降都会逐步减少偿还债务,降低信贷购买物品的实际购买价格,使其更便宜,并将资产价值提高一个档次(产生积极的财富效应)。因此,债务相对于收入和货币继续上涨,尽管偿债支付的趋势基本持平,直到利率达到0%并且不能再继续下去,此时政府不得不打印并花费大量资金弥补私营部门信贷创造和支出的减少。
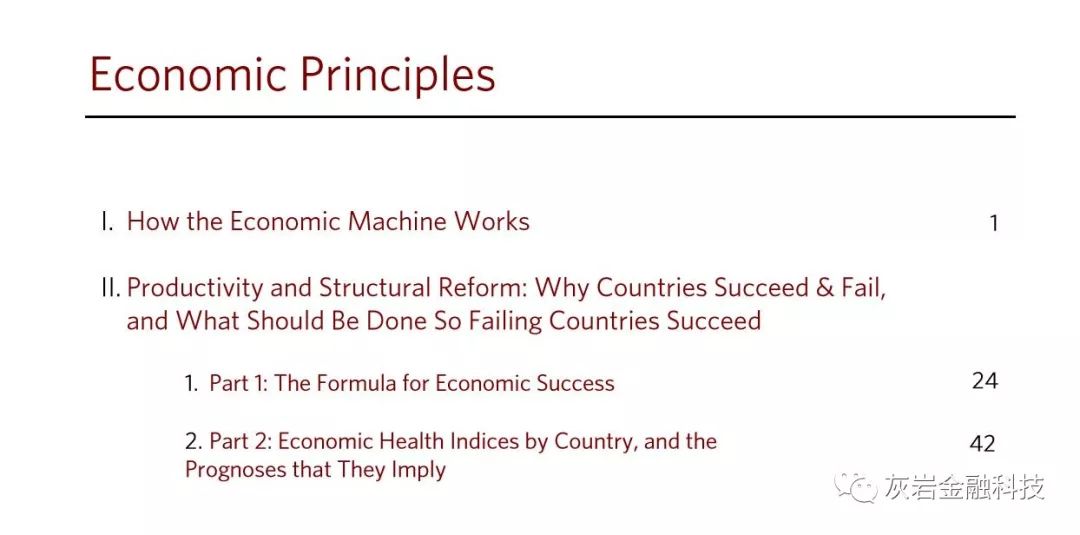
Again, for the sake of brevity, I won’t go into greater depth about the three forces' interactions here. As mentioned at the outset, this chapter is meant to just to give you a brief explanation of how I believe the economic machine works. For those who are inclined to learn more, the following chapters: “II. Debt Cycles: Leveragings & Deleveragings” and “III. Productivity and Structural Reform: Why Countries Succeed & Fail, and What Should Be Done So Failing Countries Succeed,” examine these processes in much greater depth. In chapter II, “An In-Depth Look at Deleveragings” reviews the mechanics of deleveragings across a number of cases and why some are beautiful and others ugly. The chapter concludes with detailed timelines of two classic deflationary and inflationary deleveragings – the U.S. deleveraging of the 1930s and the Weimar Republic deleveraging of the 1920s – to make clear the important cause and effect relationships at work and to convey an up-close feeling of what it was like to go through the experiences as an investor. Chapter III has two parts: “Part 1: The Formula for Economic Success”, “Part 2: Economic Health Indices by Country, and the Prognoses that They Imply” and “Part 3: The Rises and Declines of Economies Over the Last 500 Years”. The first discusses how different countries’ shares of the world economy have changed and why these changes occurred. The second examines in more depth the drivers of long term growth, the logic behind them, and what they say about the economic health of countries today.
同样,为了简洁起见,我不会更深入地探讨三种力量在这里的相互作用。正如开头所提到的,本章仅仅是为了简要说明我对经济机器如何运作的解释。对于那些倾向于了解更多信息的人,请参阅以下章节:“II。债务周期:Leveragings&Deleveragings“和”III。生产力和结构改革:为什么国家成功和失败,以及应该做什么如此失败的国家成功,“更深入地研究这些过程。在第二章“深入研究Deleveragings”中,我们回顾了一些案例中的去杠杆化的机制,以及为什么有些是美丽的,有些是丑陋的。本章最后详细描述了两个典型的通货紧缩和通货膨胀的去杠杆化 - 美国20世纪30年代的去杠杆化以及20世纪20年代的魏玛共和国去杠杆化 - 以明确工作中的重要因果关系并传达一种近距离的感觉这就像是作为投资者的经历。
第三章分为两部分:
“第一部分:经济成功的公式”,“第二部分:国家经济健康指数及其所暗示的预测”和“第三部分:过去500年经济的上升和下降” ”。第一部分讨论了不同国家的世界经济份额如何变化以及这些变化发生的原因。第二部分更深入地探讨了长期增长的驱动因素,背后的逻辑以及他们对当今国家经济健康的看法。
免责声明:上述内容仅代表发帖人个人观点,不构成本平台的任何投资建议。
- 荒野侦探·2019-01-02拜读。1举报