
Relative Strength Index (RSI)
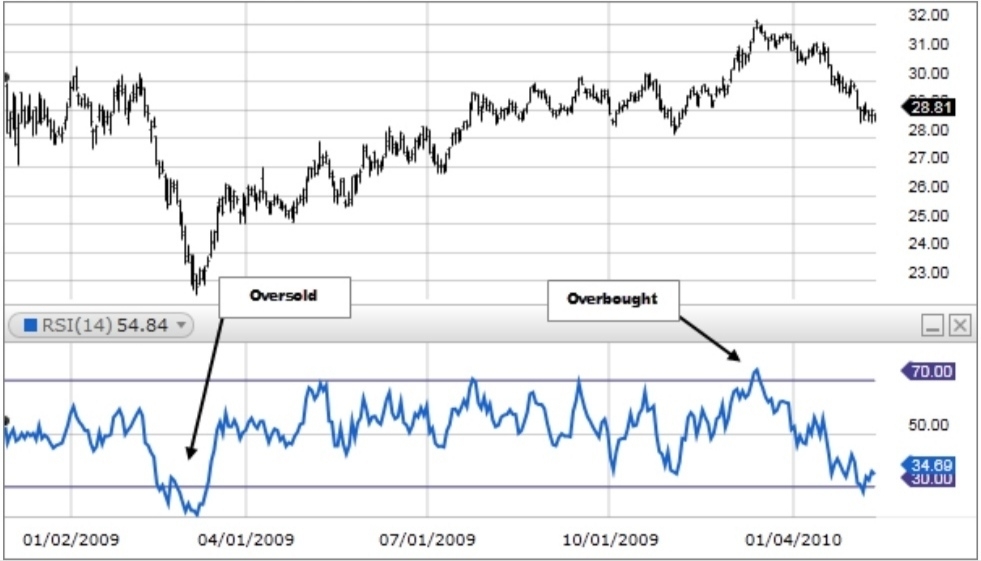
The Relative Strength Index (RSI), developed by J. Welles Wilder, is a momentum oscillator that measures the speed and change of price movements. The RSI oscillates between zero and 100. Traditionally the RSI is considered overbought when above 70 and oversold when below 30. Signals can be generated by looking for divergences and failure swings. RSI can also be used to identify the general trend.
How this indicator works
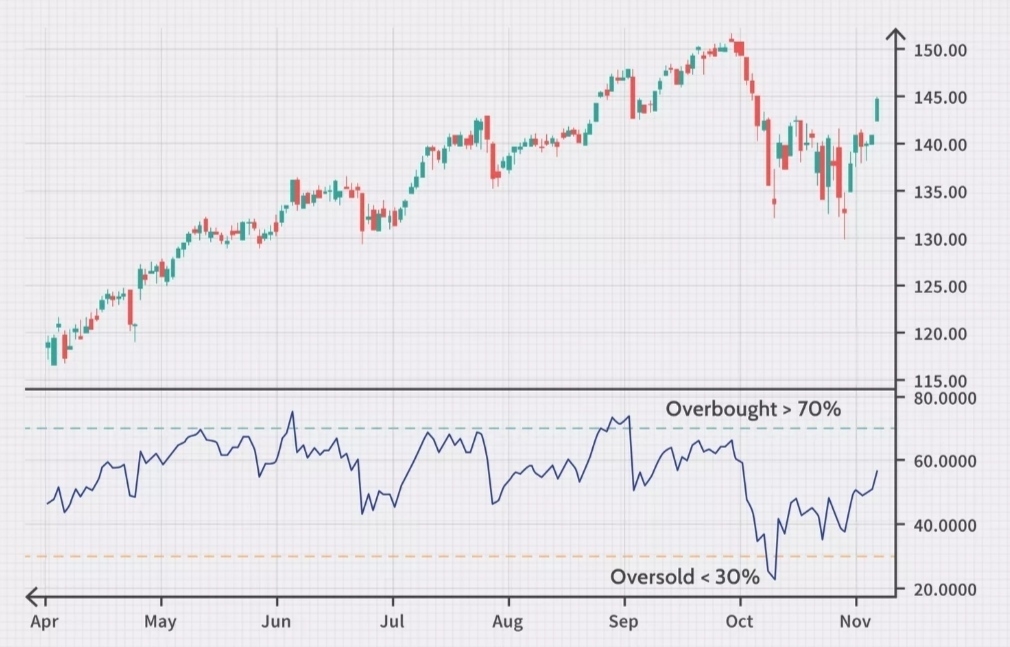
1. RSI is considered overbought when above 70 and oversold when below 30. These traditional levels can also be adjusted if necessary to better fit the security. For example, if a security is repeatedly reaching the overbought level of 70 you may want to adjust this level to 80.
Note: During strong trends, the RSI may remain in overbought or oversold for extended periods.
2. RSI also often forms chart patterns that may not show on the underlying price chart, such as double tops and bottoms and trend lines. Also, look for support or resistance on the RSI.
3. In an uptrend or bull market, the RSI tends to remain in the 40 to 90 range with the 40-50 zone acting as support. During a downtrend or bear market the RSI tends to stay between the 10 to 60 range with the 50-60 zone acting as resistance. These ranges will vary depending on the RSI settings and the strength of the security’s or market’s underlying trend.
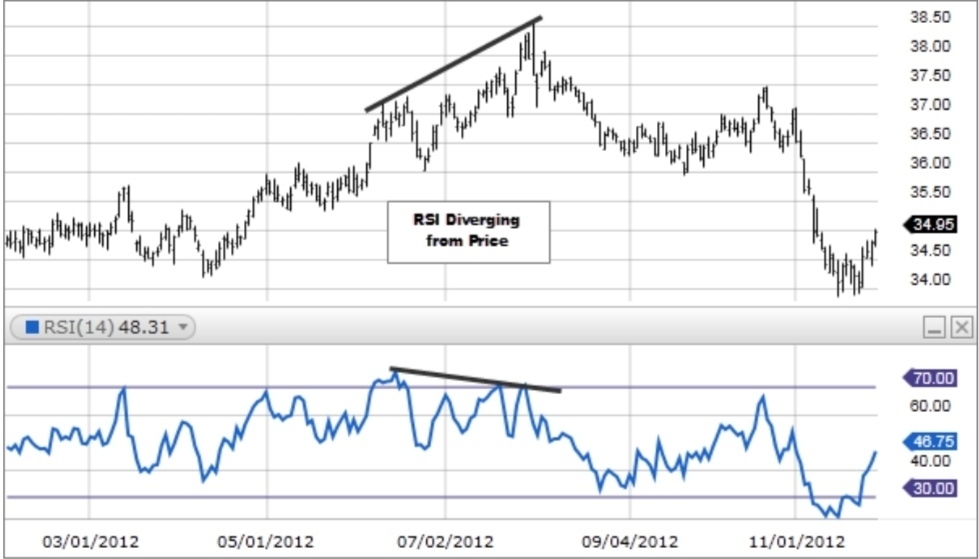
4. If underlying prices make a new high or low that isn't confirmed by the RSI, this divergence can signal a price reversal. If the RSI makes a lower high and then follows with a downside move below a previous low, a Top Swing Failure has occurred. If the RSI makes a higher low and then follows with an upside move above a previous high, a Bottom Swing Failure has occurred.
免责声明:上述内容仅代表发帖人个人观点,不构成本平台的任何投资建议。
- XD绿意盎然·2021-09-18个人决定RSI和KDJ合起来说明会不会好一点,感觉蛮像的这俩2举报
- 王无所不知·2021-09-18下一个是不是可以说说MACD啥的,好多技术指标呢,太乱了1举报
- 霎风雨·2021-09-18是不是还有个黄金交叉和死亡交叉来着?我记得不是很清楚1举报
- 超跌反弹NS·2021-09-18总而言之就是越高越卖,越低越买就是了,这样理解对吧?1举报
- 抄底反弹·2021-09-18哇塞,宝藏博主啊这是,讲的很清楚啊,如果来点案例分析就更好了1举报
- 此时不买更待何时·2021-09-18博主说的好清楚啊,爱了爱了,干货满满,收获多多1举报
- 咪咕蜡·2021-09-18高位和低位好像有个超卖区和超买区的差别,但基本上还是看快线吧?点赞举报
- 山头的小猪·2021-09-18从PE PB 跟到这里,博主分享的知识非常有用,还很好懂点赞举报
- 人之道旅行者·2021-09-18开启技术指标的篇章了吗,激动地搓手手!已经上车了点赞举报
- 不看不亏·2021-09-18RSI这个指标是我自学的,理解是看快线就行,就是那个I 线点赞举报