
Understanding of higher highs & lower lows
Most traders have heard about Dow theory and higher highs and lower lows. This article is a quick recap of this very important trading topic.
Highs and lows are major reference points for traders. The reason for this is their close link to the trend definition in chart analysis:
1. Higher highs + higher lows define an upward trend.
2. Lower highs +lower lows define a downward trend.
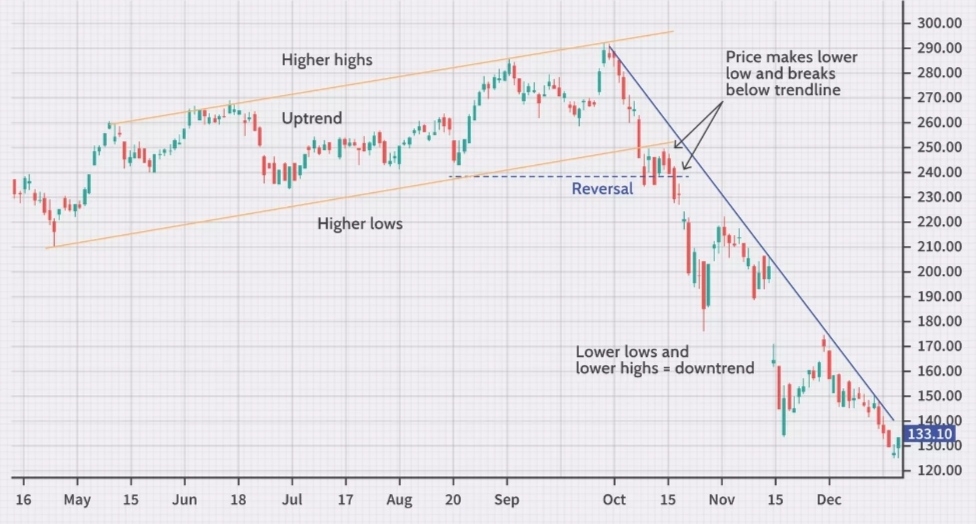
Many traders pay attention to the progress of these points. Especially in daily charts they are regarded as key points. If the market price succeeds in surpassing yesterday's high, the market is bullish. This is especially true if there is an upward trend on the daily chart, as well. Vice versa, if the market price reverses below yesterday's low, the market is bearish, particularly when complemented by a downtrend in a higher time frame. That same principle applies to all time frames.
A sideways market
There is not always a clear sequence of higher or lower highs and lows. In these cases we speak of sideways phases. These phases occur in two distinct types:
1. Range contraction: Lower highs + higher lows. This narrows the trading range which is a sign of decreasing volatility.
2. Range extension: Higher highs + lower lows. This expands the trading range expands which is a sign of increasing volatility.
Trading with Dow Theory
Many traders directly work with highs and lows. If, for example, the market is in an uptrend on the daily chart but within the day falls towards its previous day's low, this is an opportunity for a long trade. Traders would usually buy just above the previous day's low. The idea is that in order for the uptrend definition to stay valid, the market has to turn above yesterday's low and rise to higher highs, ideally. The same is true for the short side vice versa.
It is not always that simple, of course. For example, there will, at times, be fake-outs in. That is, price undercuts the previous day's low or briefly exceeds the previous day's high only to then reverse again. In order to maintain an attractive retrurn/risk ratio, traders have to accept these fake-outs as losing trades. The other option is to work with wider stop distances.
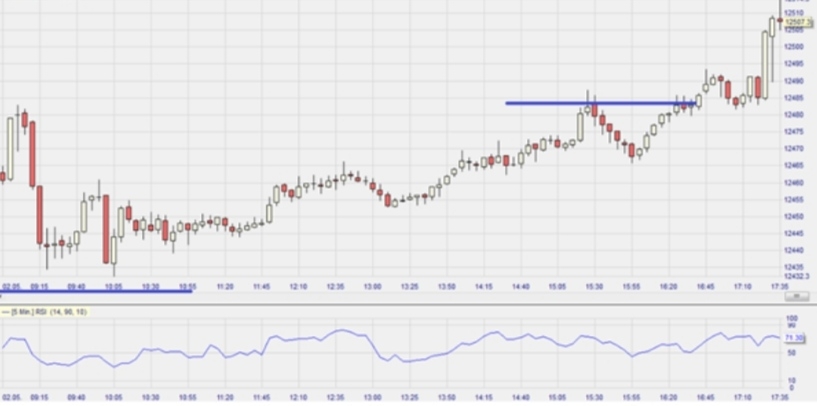
An example
This example shows higher highs + higher lows on the market index. The market initially sold off. Just above its previous day's low (first blue line), the market turned. Later on, price rose above its former intraday high (second blue line) and set new all-time highs. There was an upward trend on the daily chart supporting the setup.
免责声明:上述内容仅代表发帖人个人观点,不构成本平台的任何投资建议。
- ChristopherGonzalez·2021-10-23Learn more from your article!Thanks very much for your sharing!3举报
- 双鱼虎·2021-10-28学习了…有待消化…1举报
- 玲玲秀秀·2021-10-28很好1举报
- 中华娃·2021-10-28可以借鉴。1举报
- 国际化超人·2021-10-28什么叫高点低点,都是相对的点赞举报
- 信手而行·2021-10-28不错,学习了点赞举报
- 马到成功艳·2021-10-296点赞举报
- 美股小咸鱼·2021-10-28陌陌点赞举报
- Michael Burry·2021-10-28扯蛋1举报
- 元宇宙真牛·2021-10-28可以点赞举报
- 会短路的小可爱·2021-10-28嗯点赞举报
- 水1·2021-10-28已阅1举报
- 笑的天使·2021-10-28牛1举报
- 小鹏成·2021-10-28😁1举报
- 泰格儿沫·2021-10-28有用1举报
- 甲子乙丑·2021-10-28[得意]1举报
- fsfvghxxbgn·2021-10-28好点赞举报
- BLsince2020·2021-10-28nice点赞举报
- Reann·2021-10-28nice点赞举报
- kianhua84·2021-10-28oo点赞举报