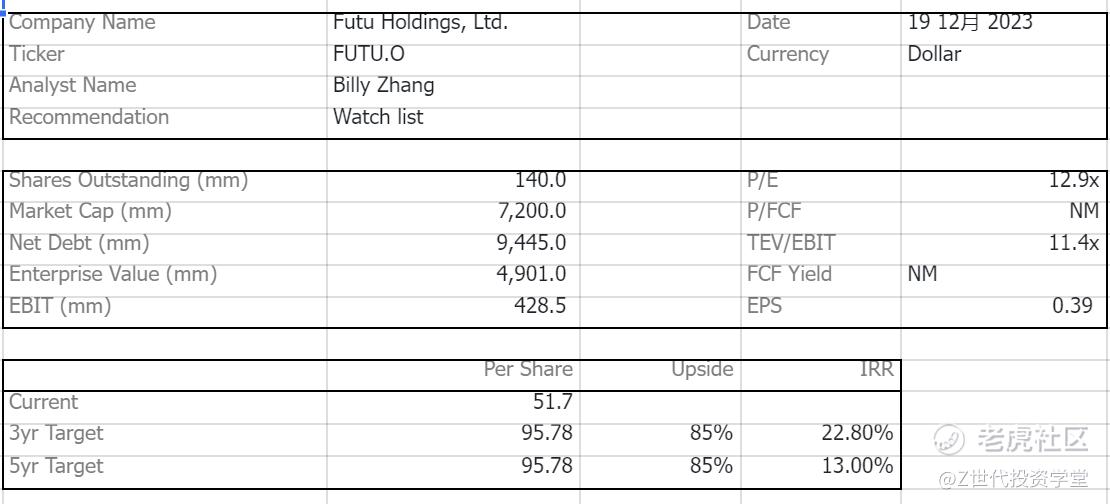
Initial Report(part1): Futu Holdings Ltd. (FUTU.O), 95.78% 5-yr Potential Upside (VIP GC, Billy ZHANG)

Template_Initial Memo 副本
Company Overview
Futu Holdings Limited is an internet brokerage company providing investors with US and Hong Kong stock trading services, with a one-stop financial trading platform, Futu Niu Niu, which supports A-shares, Hong Kong stocks, and US stocks, covering PC, MAC, iOS, and Android.It primarily serves the newly affluent Chinese population seeking a plethora of opportunities to facilitate the once-in-a-lifetime transformation of the wealth management industry and to build a broader digital portal for a wider range of financial services.
In Part 1, this article will explore two questions
(1) What does Futu's revenue consist of?
(2) How and why total and segmented revenues have changed in recent years.
Five stages of Futu growth
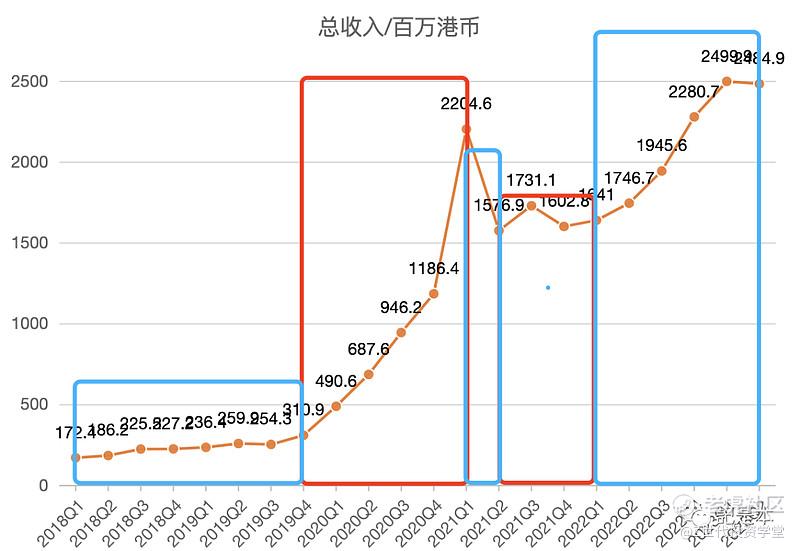
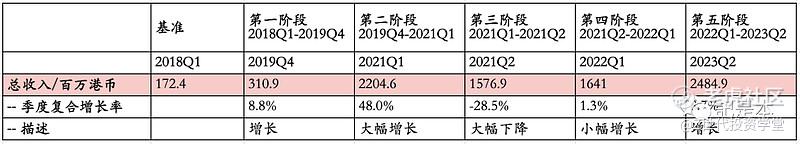
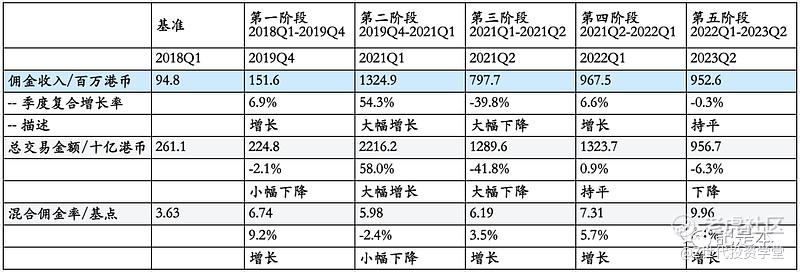
With reference to the table above, the five phases are:
1) Phase 1 2018Q1-2019Q4: total revenue grew from HK$172.4 million to HK$310.9 million, which is a period of 7 quarters, and can be calculated to have a quarterly CAGR of 8.8%
(2) Stage 2 2019Q4-2021Q1: Total revenue increased significantly from HK$310.9 million to HK$2204.6 million, representing a CAGR of 48%.
3) Stage 3 2021Q1-2021Q2: this stage only has 1 quarter, total revenue dropped significantly from HK$2204.6 million to HK$1576.9 million
4) Stage 4 2021Q2-2022Q1: total revenue shows a slight growth trend, which can also be said to be up and down
5) Stage 5 2022Q1-2023Q2: Total revenue grew at a CAGR of 8.7%.
Here we only describe how the total revenue changes in the five stages, without analyzing the specific reasons. This is because before analyzing the causes, one needs to analyze the components and influencing factors of total revenue.
So, let's take a look at the composition of total revenue.
Revenue composition
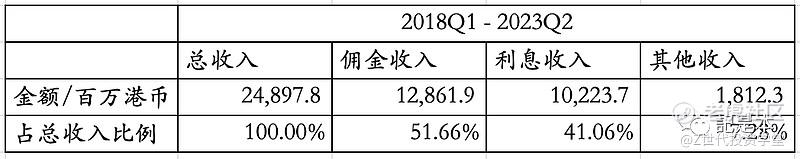
Futu's revenue has three main components: brokerage commission and fee income, interest income and other income, as shown in the table below.
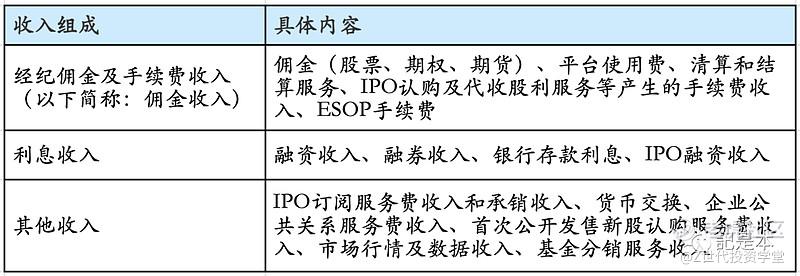
The commission income is mainly including the commission of various transactions, platform usage fee and so on. The common ones are the commissions and platform usage fees charged by Futu when we usually trade with Futu.
Interest income includes the interest charged when providing financing and securities financing to users, the interest on bank deposits, and the interest charged when providing new IPO financing. The source of funds for providing financing to customers is partly own funds; the other part is borrowings from other financial institutions, and Futu earns the difference in interest.
Other revenues are mainly from providing other services to individuals or enterprises.
Overall, the composition of revenue is relatively well understood.
Next, let's look at the percentage of each component of revenue.
Combined with the data on the ratio of the three parts of revenue to total revenue for each quarter since 2018Q1 in the chart below, it can be seen that the revenue is mainly contributed by commission income and interest income, and other revenue has a low percentage, which is less than 10% overall.
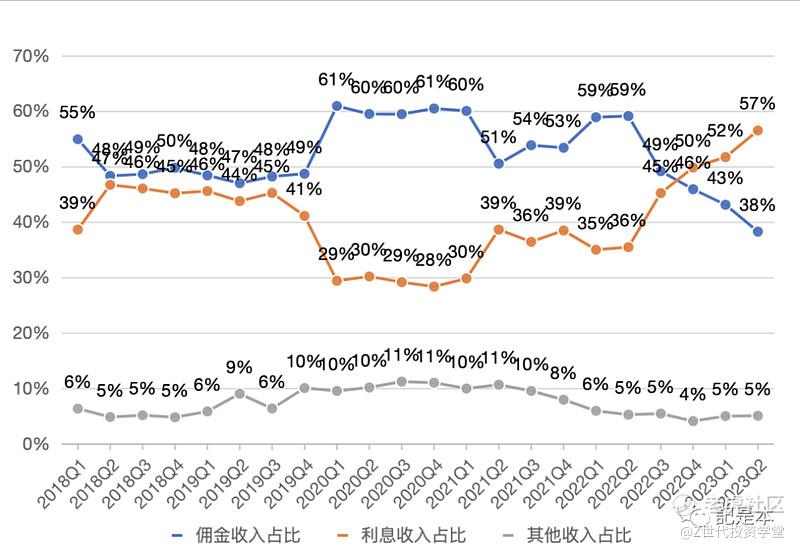
Since other revenues account for a very small percentage and commission income and interest income together account for 90%+, we will focus on analyzing commission income and interest income next.
Commission revenue
According to the information provided in Futu's earnings report, commission revenue can be expressed by this formula:
Commission Revenue = Transaction Amount * Blended Commission Rate.
The transaction amount is the amount of money that the user has traded on Futu.
The blended commission rate is the percentage of the transaction amount that Futu charges in commissions, platform usage fees, and other fees.
For example, if a user buys a stock for HK$10,000 (the transaction amount), and Futu charges a commission and platform usage fee of HK$10, then the commission rate is 10/10,000, or 10 basis points (1 basis point = 1/10,000).
Next, let's look at the change in the transaction amount and the blended commission rate.
Transaction Amount
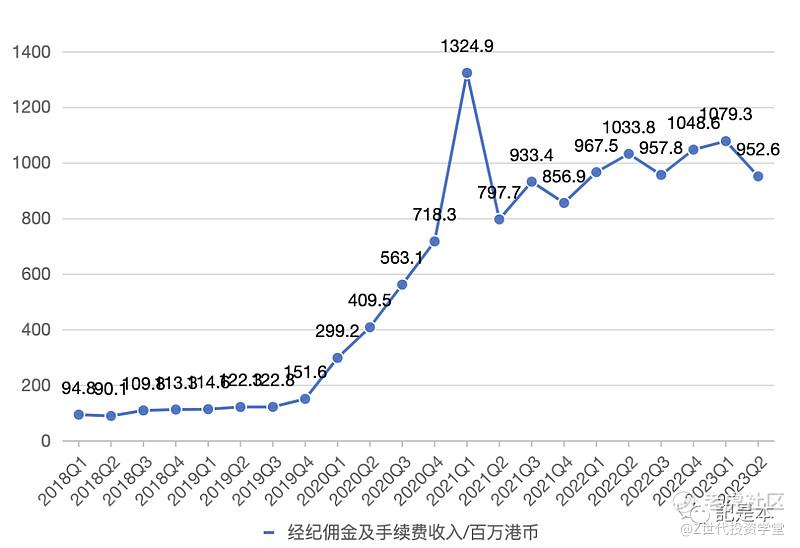
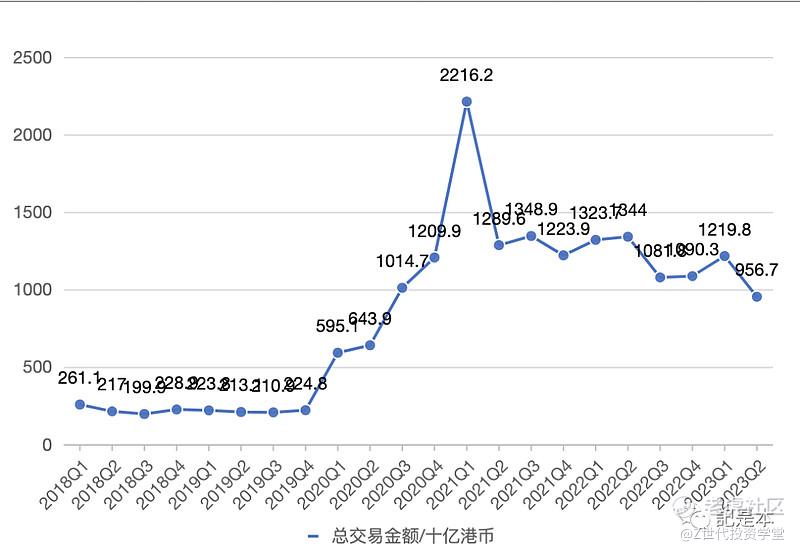
The chart below shows Futu's commission revenue and transaction amount by quarter. It can be seen that the growth and decline of commission revenue is very close to the trend of transaction amount, when transaction amount increases, commission revenue also increases and vice versa.
This is really determined by the formula for commission revenue, which trends exactly in line with the transaction amount, assuming the blended commission rate remains constant.
For the transaction amount, it can also be broken down into two parts: U.S. stock transaction amount, Hong Kong stock transaction amount plus HFT transaction amount. The correlation between Futu's transaction amount and the overall market trading activity is very high.
Looking at the chart below, Futu's U.S. stock trading amount is very much in sync with the trend of Nasdaq volume, and so is the trend of Hong Kong stock + Shanghai-Hong Kong Stock Connect trading amount with the trend of Hang Seng Index turnover.
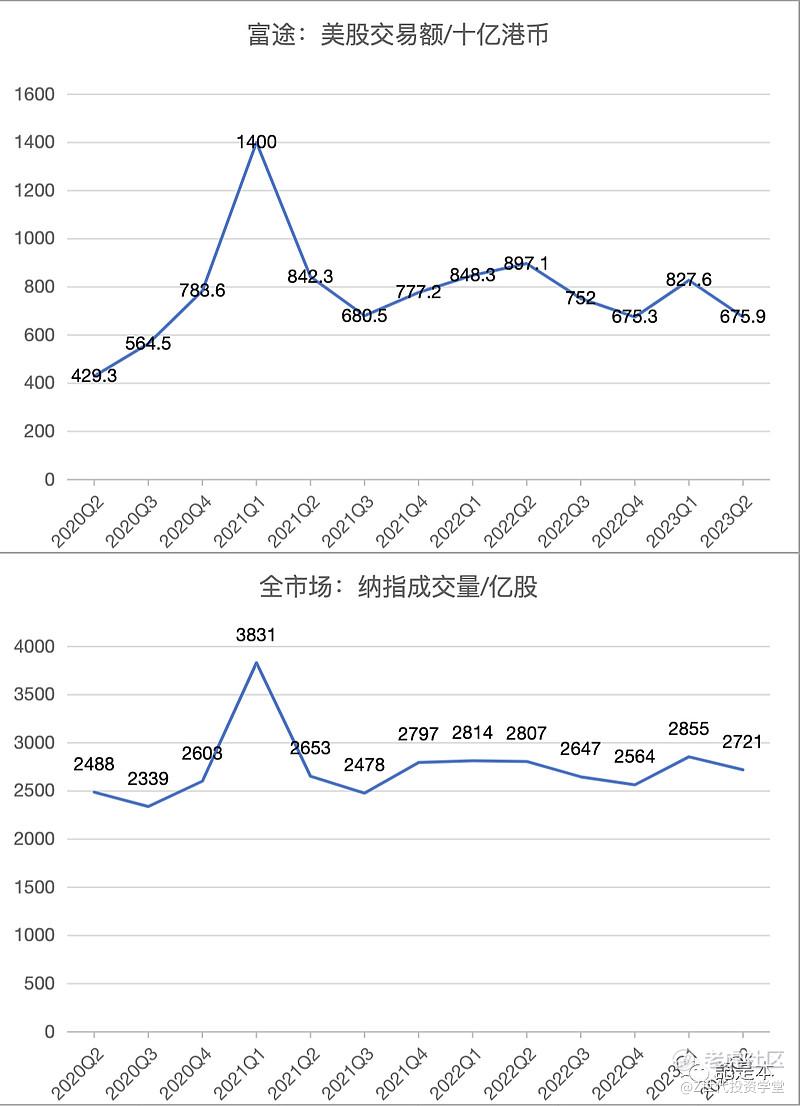
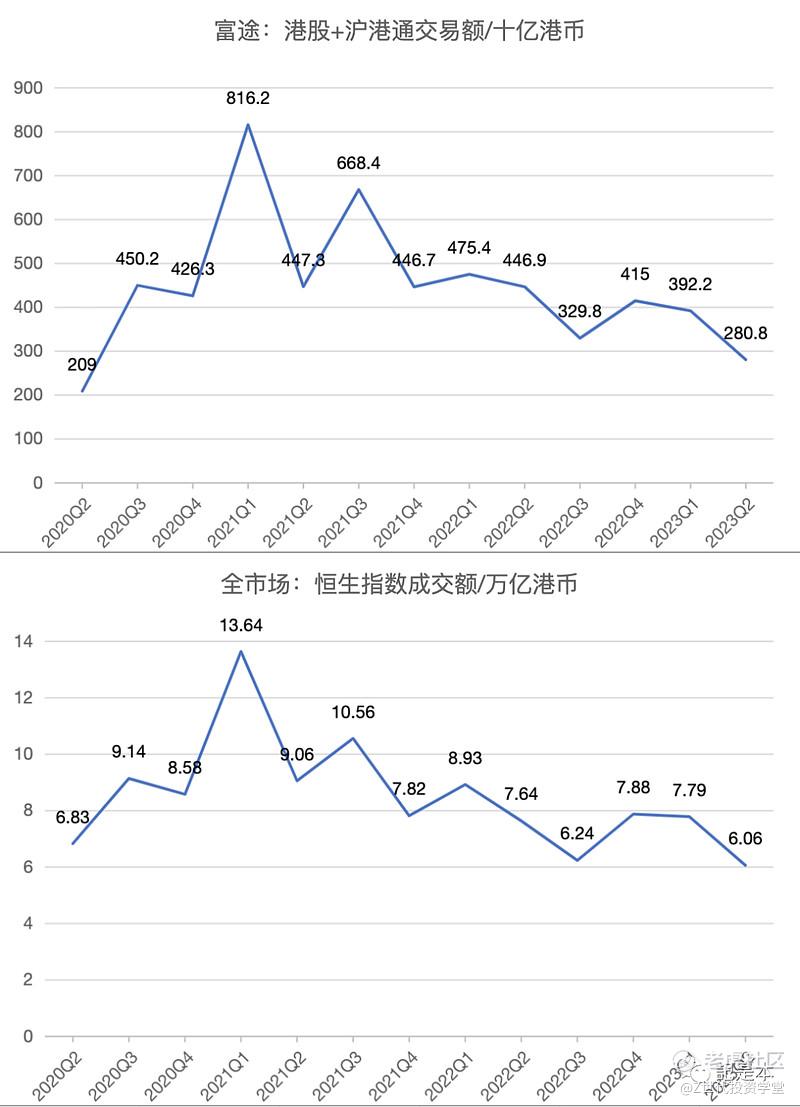
That is to say, when the market is active, Futu's trading volume will also be high, and the commission income will increase significantly; while when the market is cool, Futu's trading volume will also drop, and the commission income will follow.
Mixed Commission Rates
Although Futu's transaction amount is affected by market activity and is less predictable, the overall trend of Futu's blended commission rate is increasing (see the chart below).
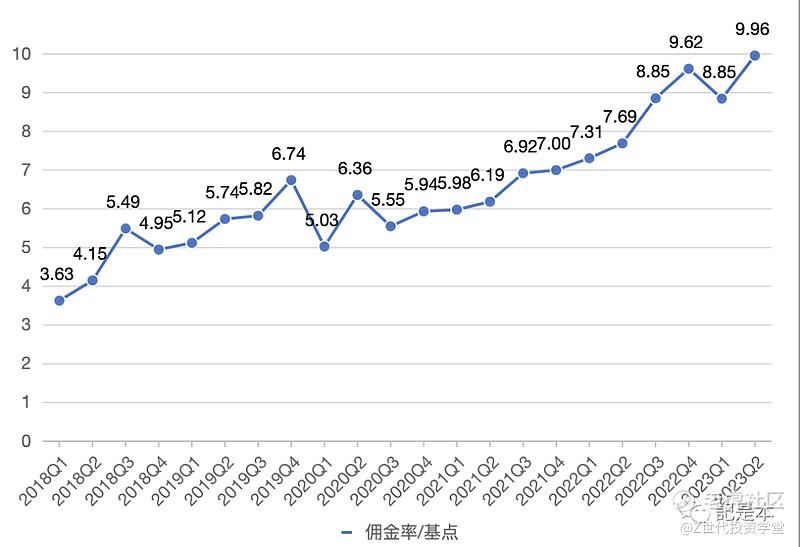
The reason for the rise could be due to the fact that the commission offers to users are decreasing. For example, as the number of points users use to redeem commission coupons decreases, the amount of commission users have to spend becomes more.
Of course, it is still unknown whether commission rates will continue to rise in the future and, if they do, how much room there is for them to rise.
Changes and Reasons
Based on the above changes in transaction amount and blended commission rate, we can get the reasons for the changes in commission income in each stage (combined with the table below):
(1) Stage 1: commission revenue grew from HK$94.8 million to HK$151.6 million, a CAGR of 6.9%; the growth was mainly driven by an increase in the blended commission rate and a small decline in the total transaction amount
(2) Stage 2: Commission revenue grew significantly, driven by a hot market that brought about a significant increase in transaction value and a slight decline in the blended commission rate.
(3) Phase 3: commission income fell sharply, driven by a rapid cooling of the market and a significant decline in transaction value for Futu, with an increase in the blended commission rate
(4) Stage 4: Commission income increased, mainly due to an increase in the blended commission rate, and the transaction amount remained flat
(5) Stage 5: Commission revenue was flat, blended commissions were still growing but were offset by a decline in deal value
Interest revenue
The following table shows the composition of interest income for the past five years. It can be seen that, except for the bridge loan, all the others are interest income generated from financing and bank deposits, while the interest income from the bridge loan does not account for a high percentage.
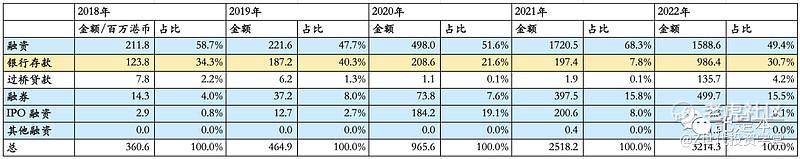
Therefore, in the following, we mainly analyze the financing financing and bank deposits.
Similar to commission income, for interest income, suppose we can also express it with a formula:
Interest Income ≈ (Finance Facility Scale + Bank Deposit) * Blended Interest Rate.
The reason why it is an assumption here is because Futu's financial report does not use such logic, and here are the assumptions made in this article in order to analyze the interest income. Just to illustrate, interest income is related to financing and financing scale, bank deposits and blended interest.
Look back at the formula. The size of the financing facility can be obtained from the financing facility balance in the financial report. Although the financing facility balance only represents the user's financing facility size at the end of the period, it cannot accurately represent the user's financing facility size during the period. However, we can still see the approximate size of financing and financing from the ending balance of financing and financing.
A large part of the interest income from bank deposits comes from Futu's cash held on behalf of customers, and this data can be obtained from the balance sheet.
Although we don't know exactly what the blended interest rate is from the financial report, the blended interest rate is certainly proportional to the market interest rate. So, we can analyze it with the help of the trend of market interest rates.
Below we will analyze the changes and reasons for Futu's interest income with the help of financing balance, bank deposits (cash held on behalf of customers) and market interest rates.
修改于 2024-04-02 22:24
免责声明:上述内容仅代表发帖人个人观点,不构成本平台的任何投资建议。