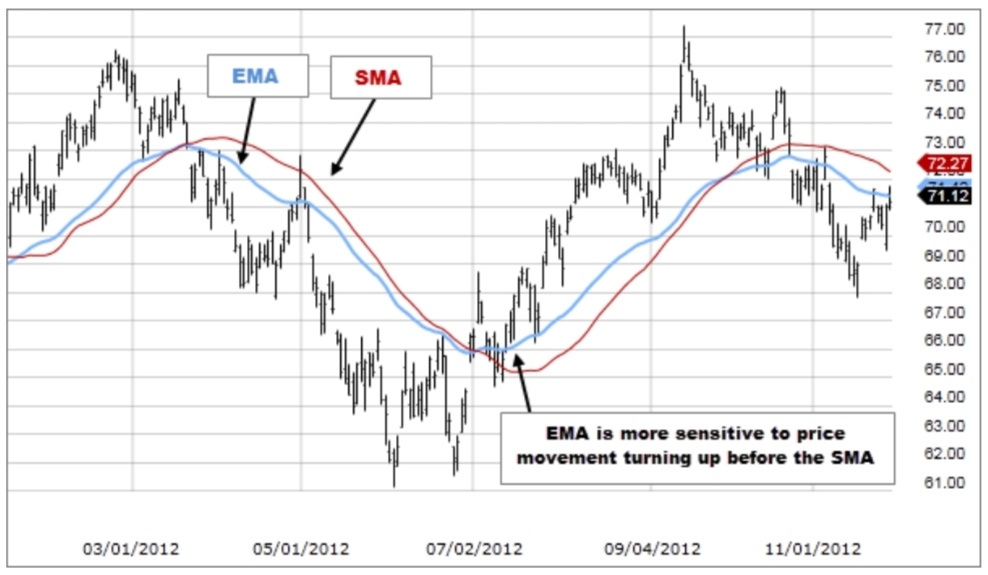
Exponential Moving Average (EMA) is similar to Simple Moving Average (SMA), measuring trend direction over a period of time. However, whereas SMA simply calculates an average of price data, EMA applies more weight to data that is more current. Because of its unique calculation, EMA will follow prices more closely than a corresponding SMA.
How this indicator works
1. Use the same rules that apply to SMA when interpreting EMA. Keep in mind that EMA is generally more sensitive to price movement. This can be a double-edged sword. On one side, it can help you identify trends earlier than an SMA would. On the flip side, the EMA will probably experience more short-term changes than a corresponding SMA.
2. Use the EMA to determine trend direction, and trade in that direction. When the EMA rises, you may want to consider buying when prices dip near or just below the EMA. When the EMA falls, you may consider selling when prices rally towards or just above the EMA.
3. Moving averages can also indicate support and resistance areas. A rising EMA tends to support the price action, while a falling EMA tends to provide resistance to price action. This reinforces the strategy of buying when the price is near the rising EMA and selling when the price is near the falling EMA.
4. All moving averages, including the EMA, are not designed to identify a trade at the exact bottom and top. Moving averages may help you trade in the general direction of a trend, but with a delay at the entry and exit points. The EMA has a shorter delay than the SMA with the same period.
Key Takeaways
1. Exponential moving averages (EMAs) are designed to see price trends over specific time frames, such as 50 or 200 days.
2. Compared to simple moving averages, EMAs give greater weight to recent (more relevant) data.
3. Computing the EMA involves applying a multiplier to the simple moving average (SMA).
4. Moving average ribbons allow traders to see multiple EMAs at the same time.
精彩评论