Start of A Bear Market or Normal Market Correction?
The black Friday selloff on 26 Nov 2021 triggered by the COVID-19 variant — Omicron was significant and certainly is a change of character in S&P 500, Dow Jones and Russell 2000. Nasdaq was the strongest despite dropping close to 2% and it still did not break the swing low support near 15900.
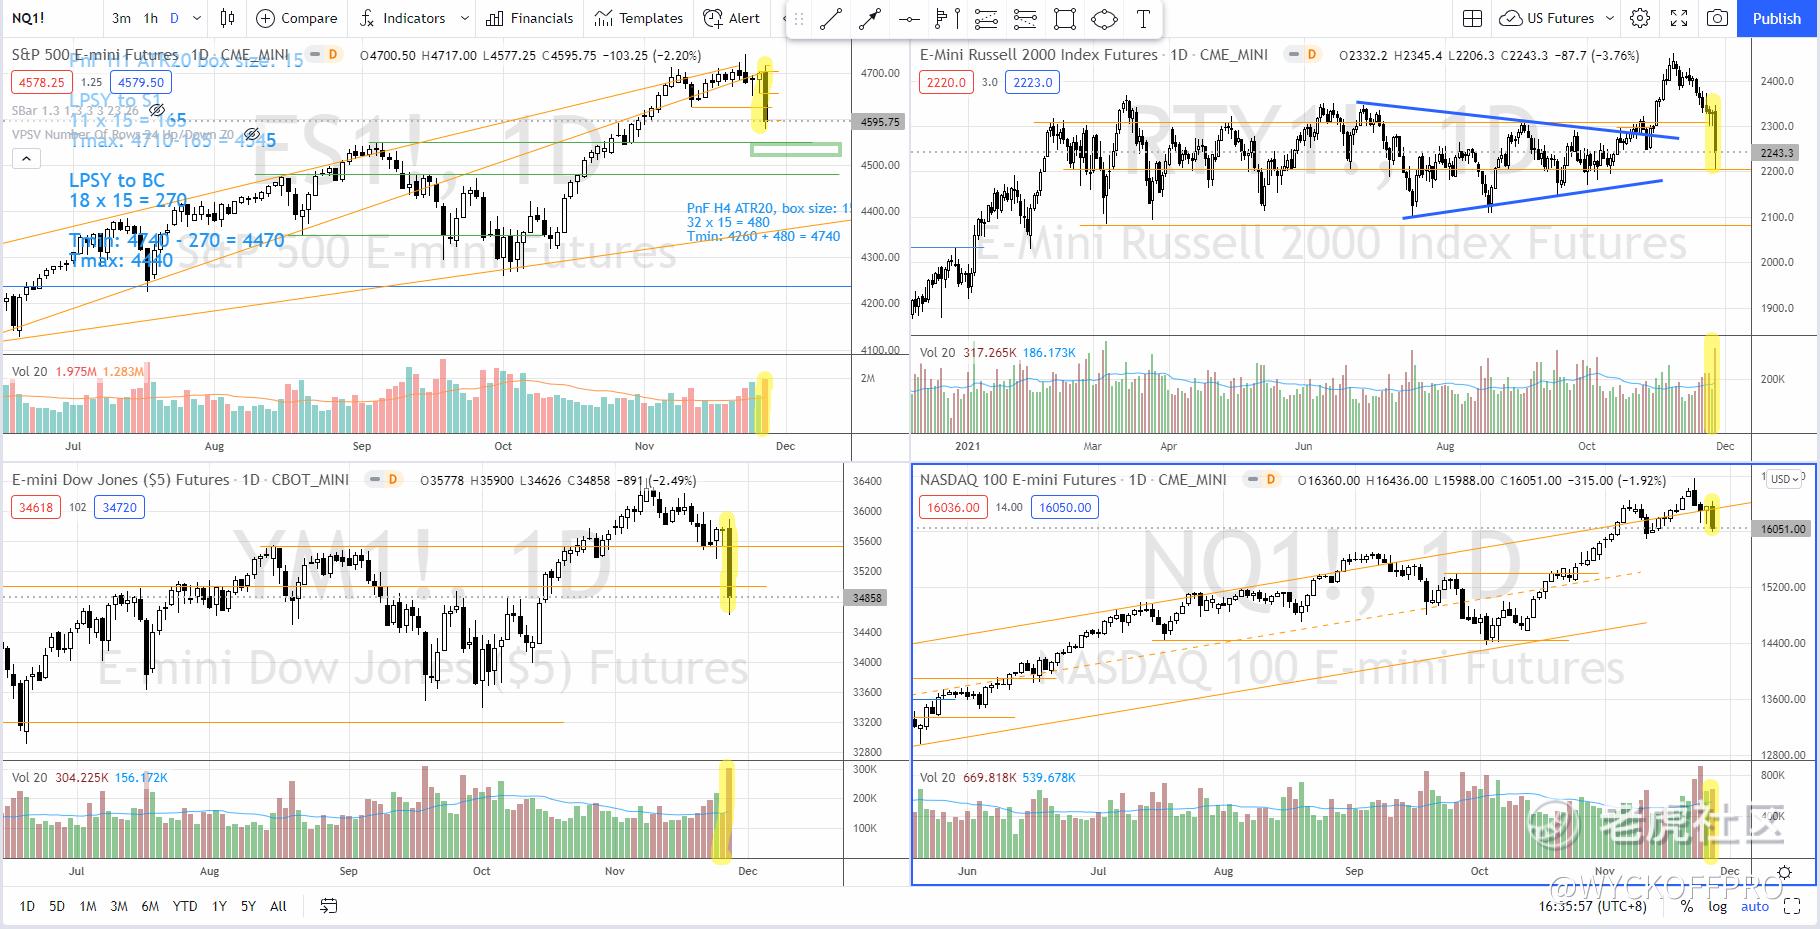
As highlighted in the daily chart above, the spread of Friday’s candle (highlighted in yellow) is easily the top 3 biggest in this year. If we focus on the up wave since 13 Oct, Friday’s bar is certainly considered as a change of character bar, which stops the uptrend from 13 Oct, at least into a trading range (or a reversal to the downside).
Price Structure Context
Context is probably the most important thing we need to look into when analyzing the chart. According to the candlestick pattern books, shooting star or bearish engulfing is bearish, right? Wrong!
If you experience in your trading journey and found that candlestick pattern only works some of the time, it is time to pay attention to the context and the volume on top of the pattern.
Let’s take a closer look at the S&P 500 daily chart below:
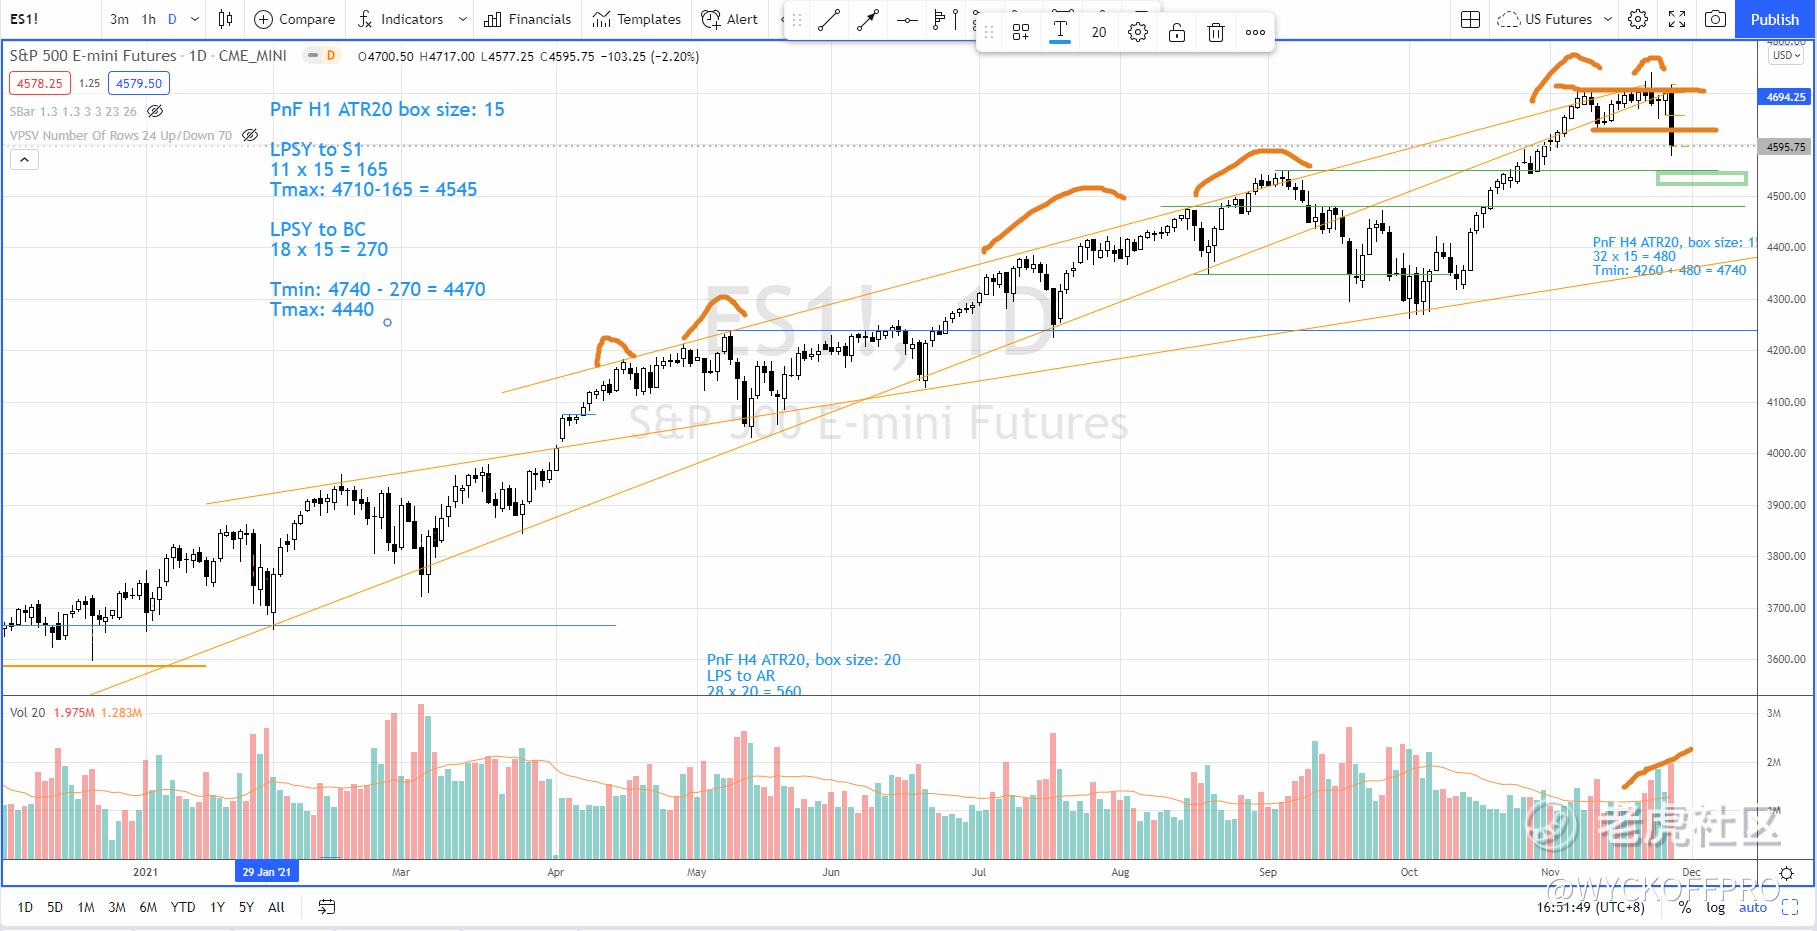
Since 13 Oct, S&P 500 had a climatic rally bumping into overbought of the up channel. Subsequently it formed a trading range. On 22 Nov (last Monday), there was an up thrust happened where the price failed to commit above the resistance level formed by the swing high with increasing supply.
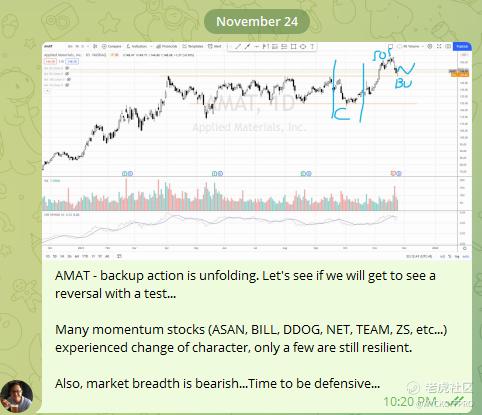
Despite on the next two days, S&P 500 did not have follow through to the downside (even formed demand tails), there were many leadership stocks such as AEHR, $Asana, Inc.(ASAN)$ , $Bill.Com Holdings, Inc.(BILL)$ , $Datadog(DDOG)$ , $Cloudflare, Inc.(NET)$ , $Atlassian Corporation PLC(TEAM)$ , ZS, etc… experienced a steep selloff acted as a change of character on 22 Nov, as mentioned in my private Telegram post — time to be defensive.
Distribution Price Targets on P&F Chart
Last Friday’s bearish bar broke below the swing low support around 4620 with increasing of supply even it was a short trading session. This small trading range with tell-tale signs of distribution characteristics has some causes built for larger downward price targets, as shown in the Point and Figure (P&F) chart below.
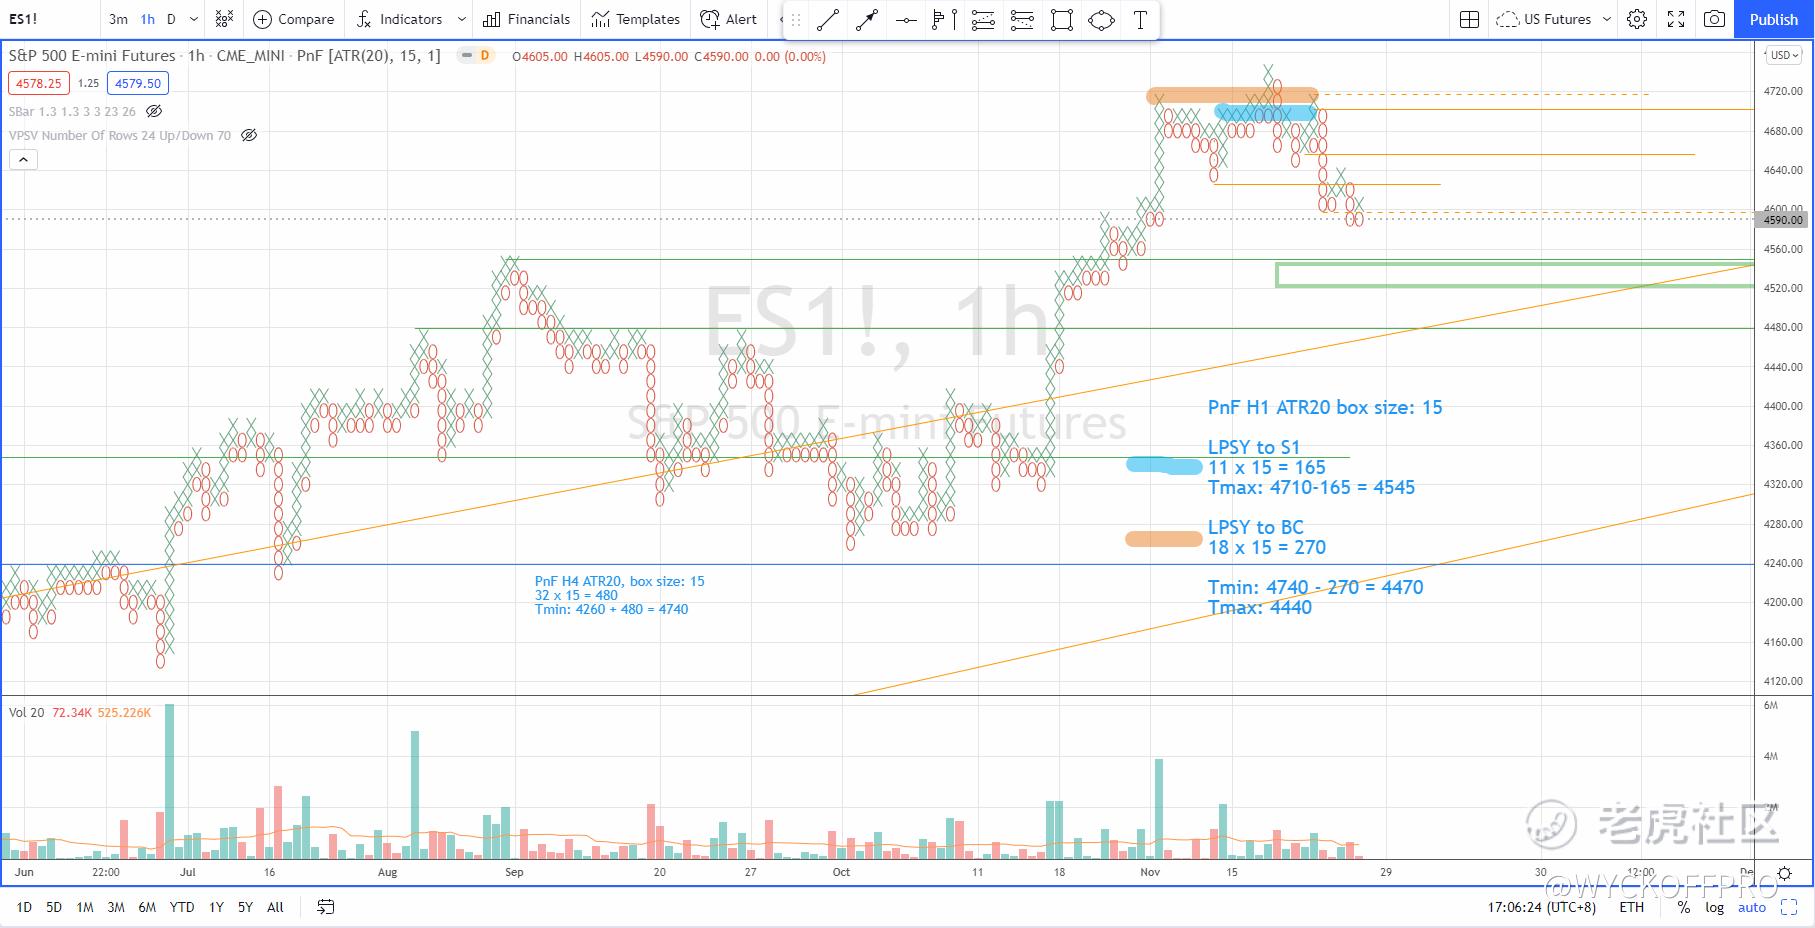
I would not be surprise if there is more panic selling on Monday since the demand was poor on last Friday and there was fuel in the tank for more downside price targets based on the P&F price targets projection.The first target is 4545, which coincides with the axis line where the previous resistance become support.The second target is around 4440–4470, which is near the previous accumulation structure.
Should the bearish momentum carry the S&P 500 to the price target zone, we need to judge the rebound from there in terms of the price action characteristics and the volume.
As the price is unfolding, it is key to pay attention to the volume together with the behaviors of the price action to anticipate the next direction. This is the only way to judge if it is just a normal market correction or the start of a bear market.
I have locked in some profits and took some loss with early exit on 23–24 Nov and I will continue to tighten the stop for other positions to hold more cash and lighten the portfolio.
Safe trading. If you are day trading the US futures or swing trading for Malaysia and US stocks, do check out my YouTube Channel: Ming Jong Tey for additional videos and resources. @Tiger Stars
Further Reading
Here's what history says about Crude Oil performance
Over-Extended Stock Market Rally At a Vulnerable Point?
免责声明:上述内容仅代表发帖人个人观点,不构成本平台的任何投资建议。
- Tiger_story·2021-11-29i personally believe it is normally market correction. wish i was right,lol😂, anyway thanks for your sharing.2举报
- LesleyNewman·2021-11-29I don' t think so. I think there are still opportunities in the stock market. and the returns and risks always correspond, so they are likely to soar.🤔点赞举报
- FabianGracie·2021-11-29I believe the volume will stay at this level for a while and a lot of people will buy very quickly. because they think it's time, but they are wrong!点赞举报
- JackPowell·2021-11-29It's clear that if this trend continues, the selling will get worse and worse, and everyone wants a good buying opportunity.🤣🤣点赞举报
- AgathaHume·2021-11-29your analysis is so great, now the power of buy and sell is not balanced.点赞举报
- Tracccy·2021-11-29it's clear that everyone expects that, and that adds to the downward pressure on the stock market.点赞举报
- BonnieHoyle·2021-11-29well, that's a good analysis, but I don't think we're as hung up as we used to be.点赞举报