25 March 2021
Bond yield retreated but so did stocks.
The past few weeks we saw how easy money could boost markets. A term i would like to use - Retail Investors frenzy. So much money in my pocket but no where meaningful to spend, other than the stock market that is. But what happens when the effects of these policy fades?
And this has happened in the chinese markets. I would consider China as the pioneer in this whole covid era. They were the first to get hit by Covid, first to get out, their stock market was the firsr to recover and now their stock market is the first to see the effects of government policy fades.
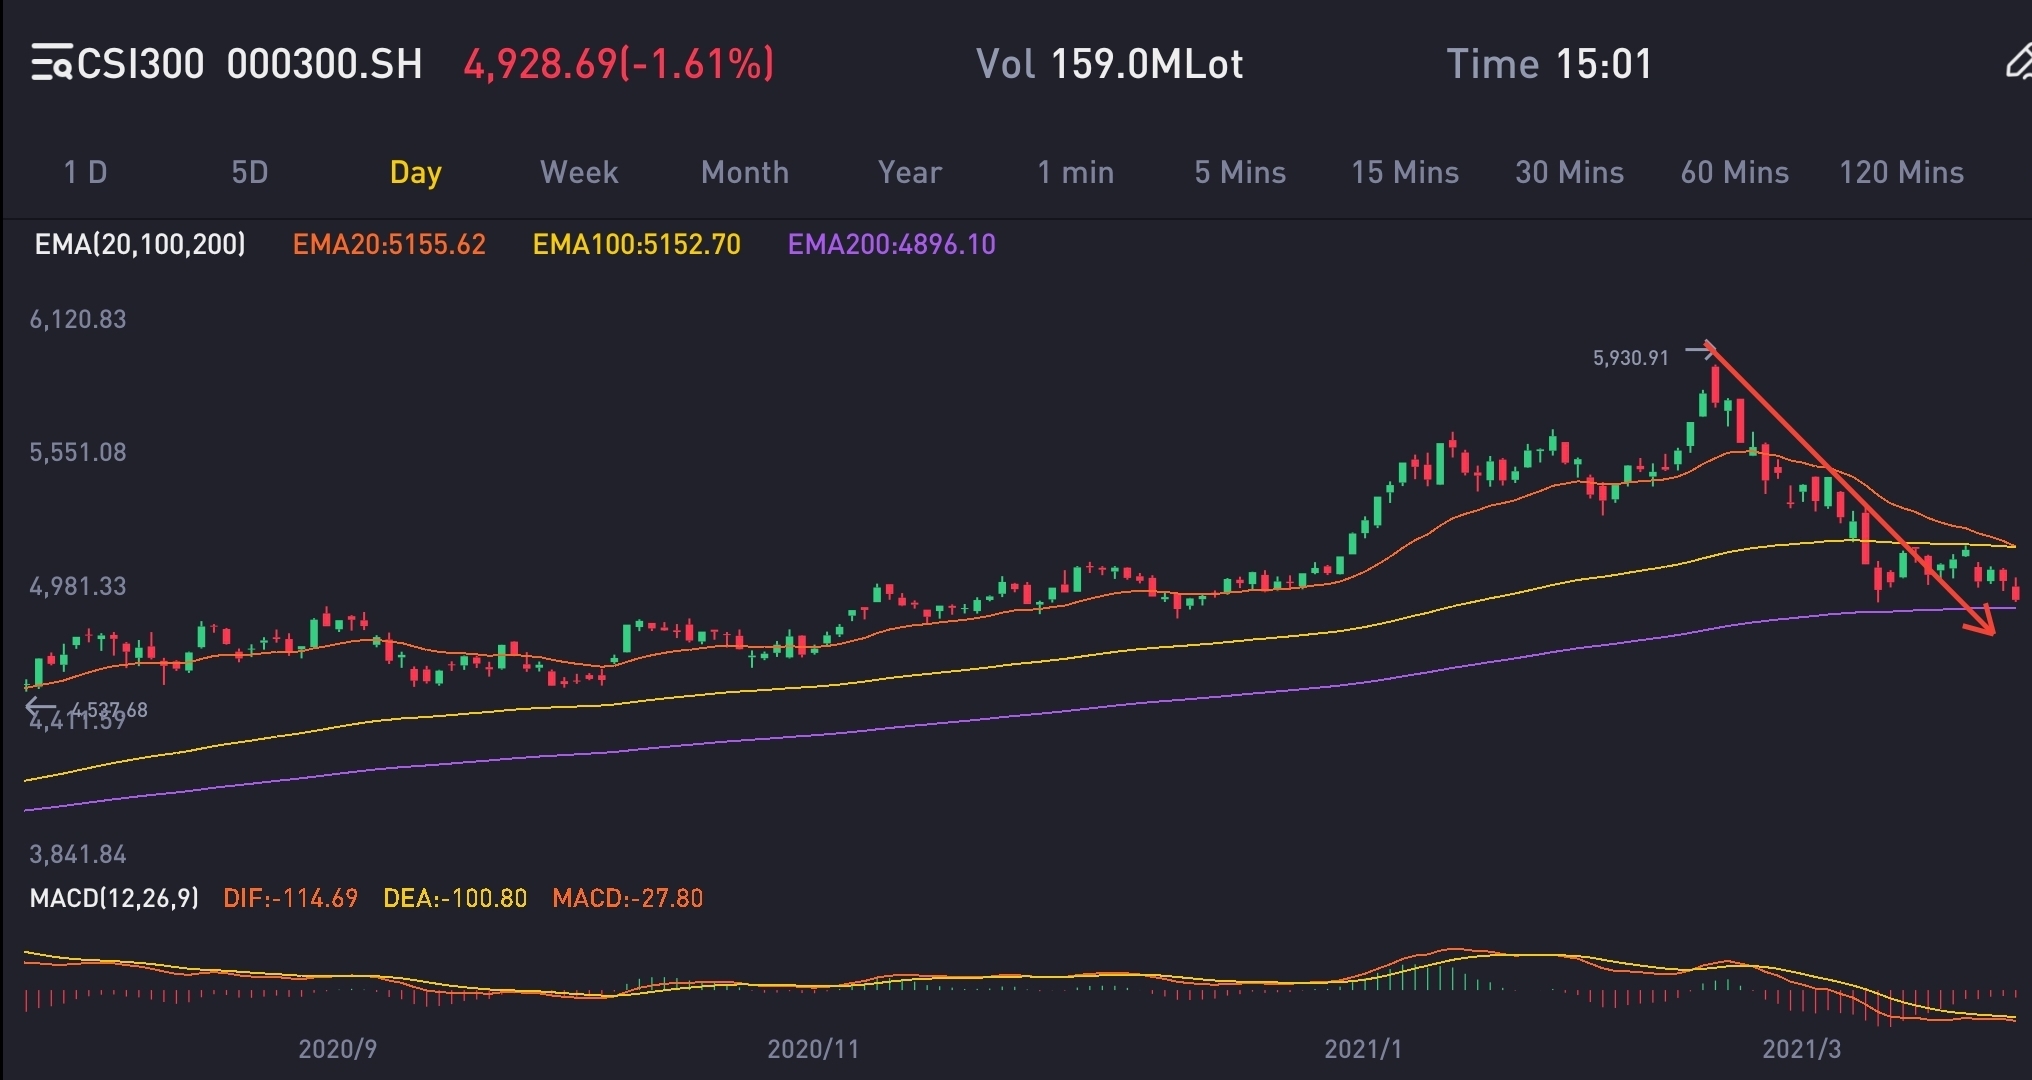
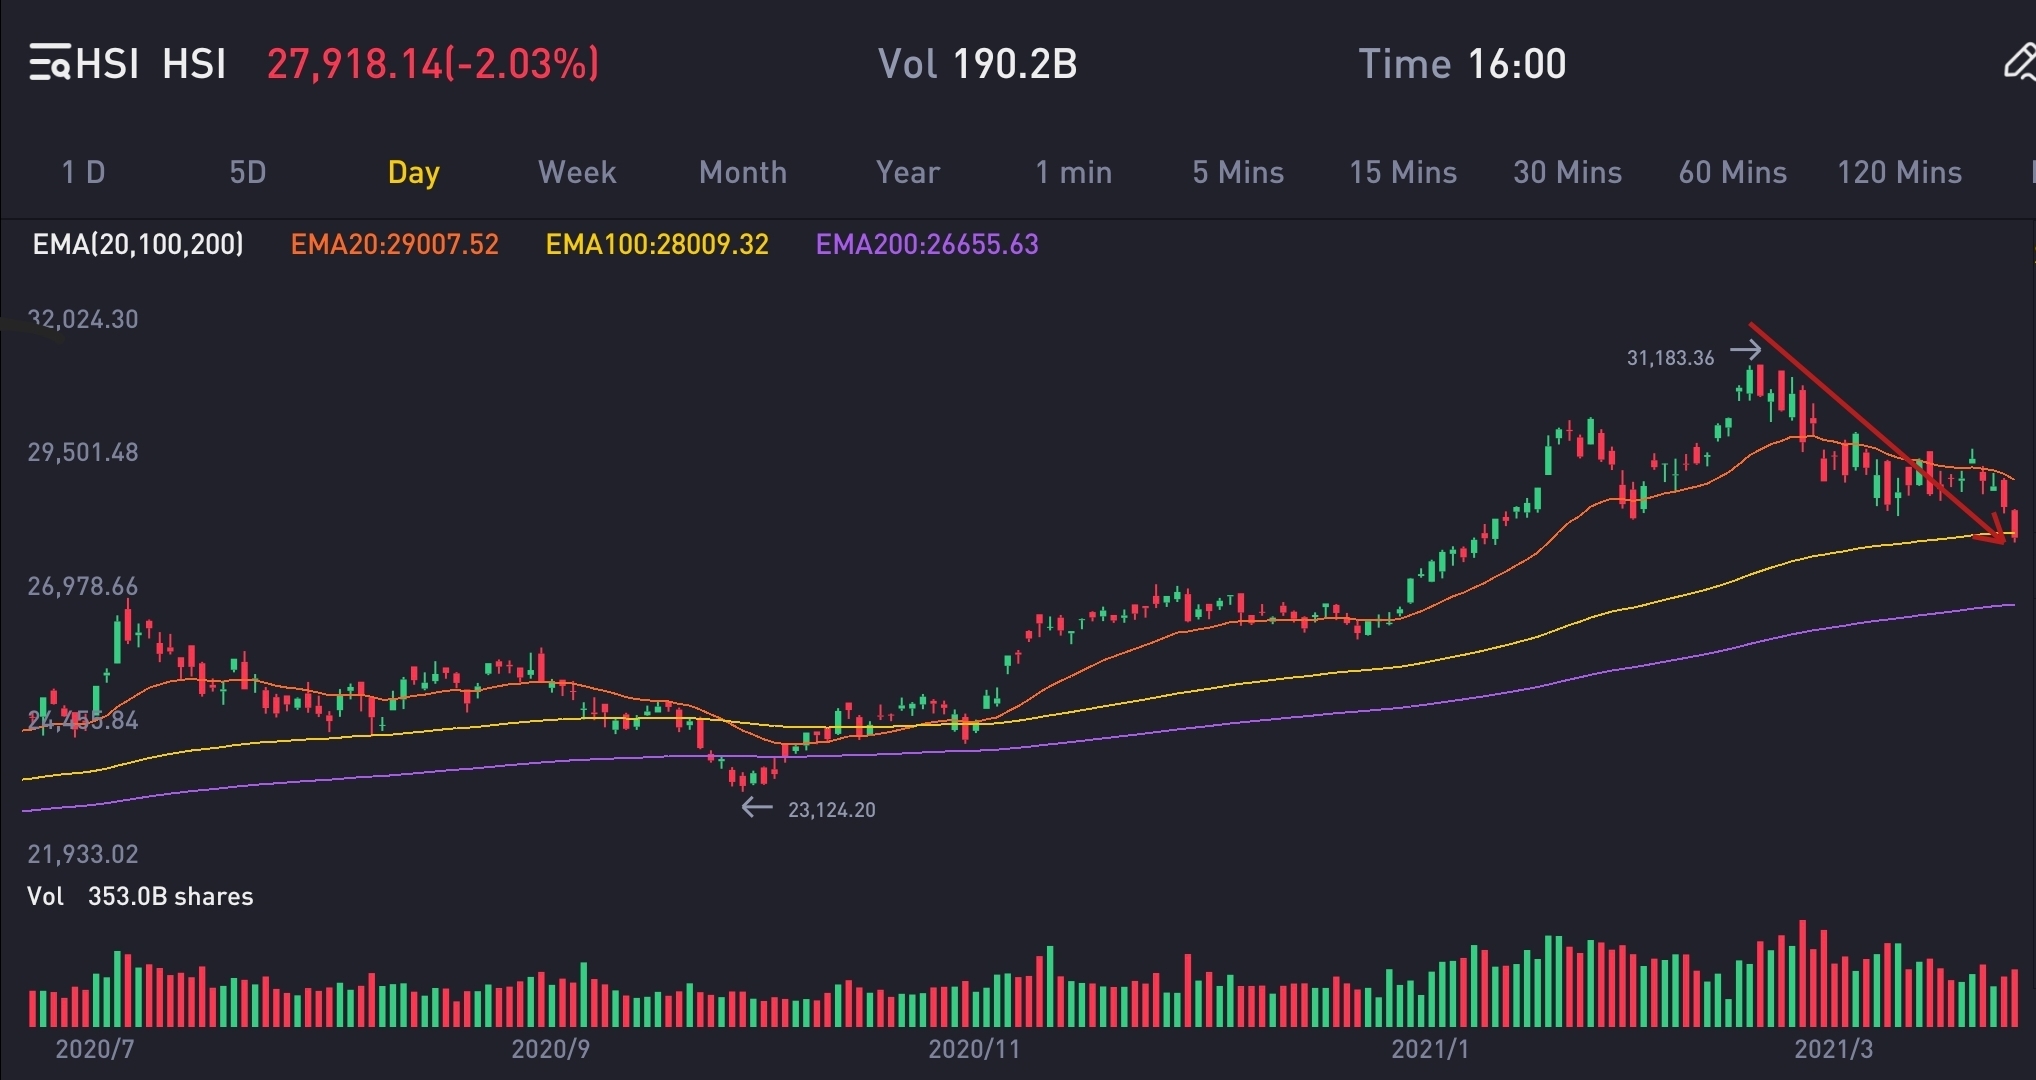
Looking at the charts, the CSI300 lost 17% and HSI loss 10%.
This is why fundamentals of the companies you invest in is important. Have companies been making good use of the liquidity the government pumped into the economy? How has the company earnings been doing?
Back to the quote by Warrant Buffet: "Only when the tide goes out do you discover who has been swimming naked".
Taking reference from Tiger's valuation report,
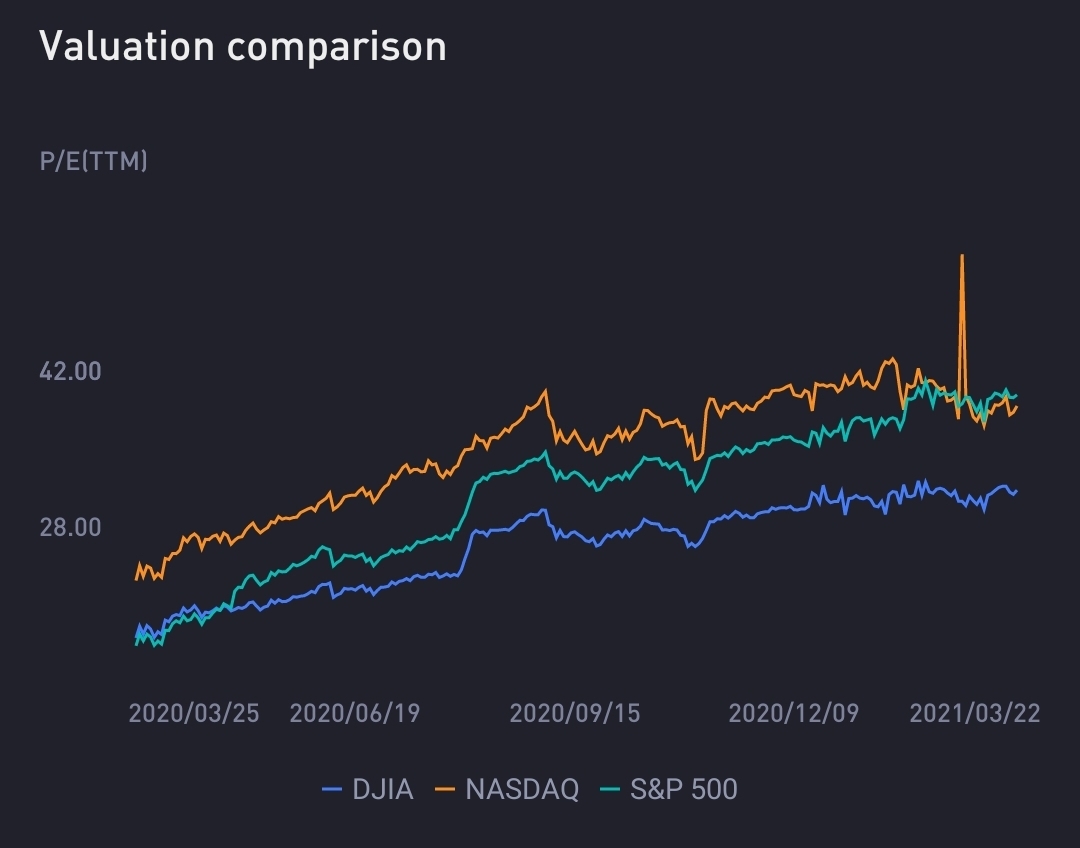

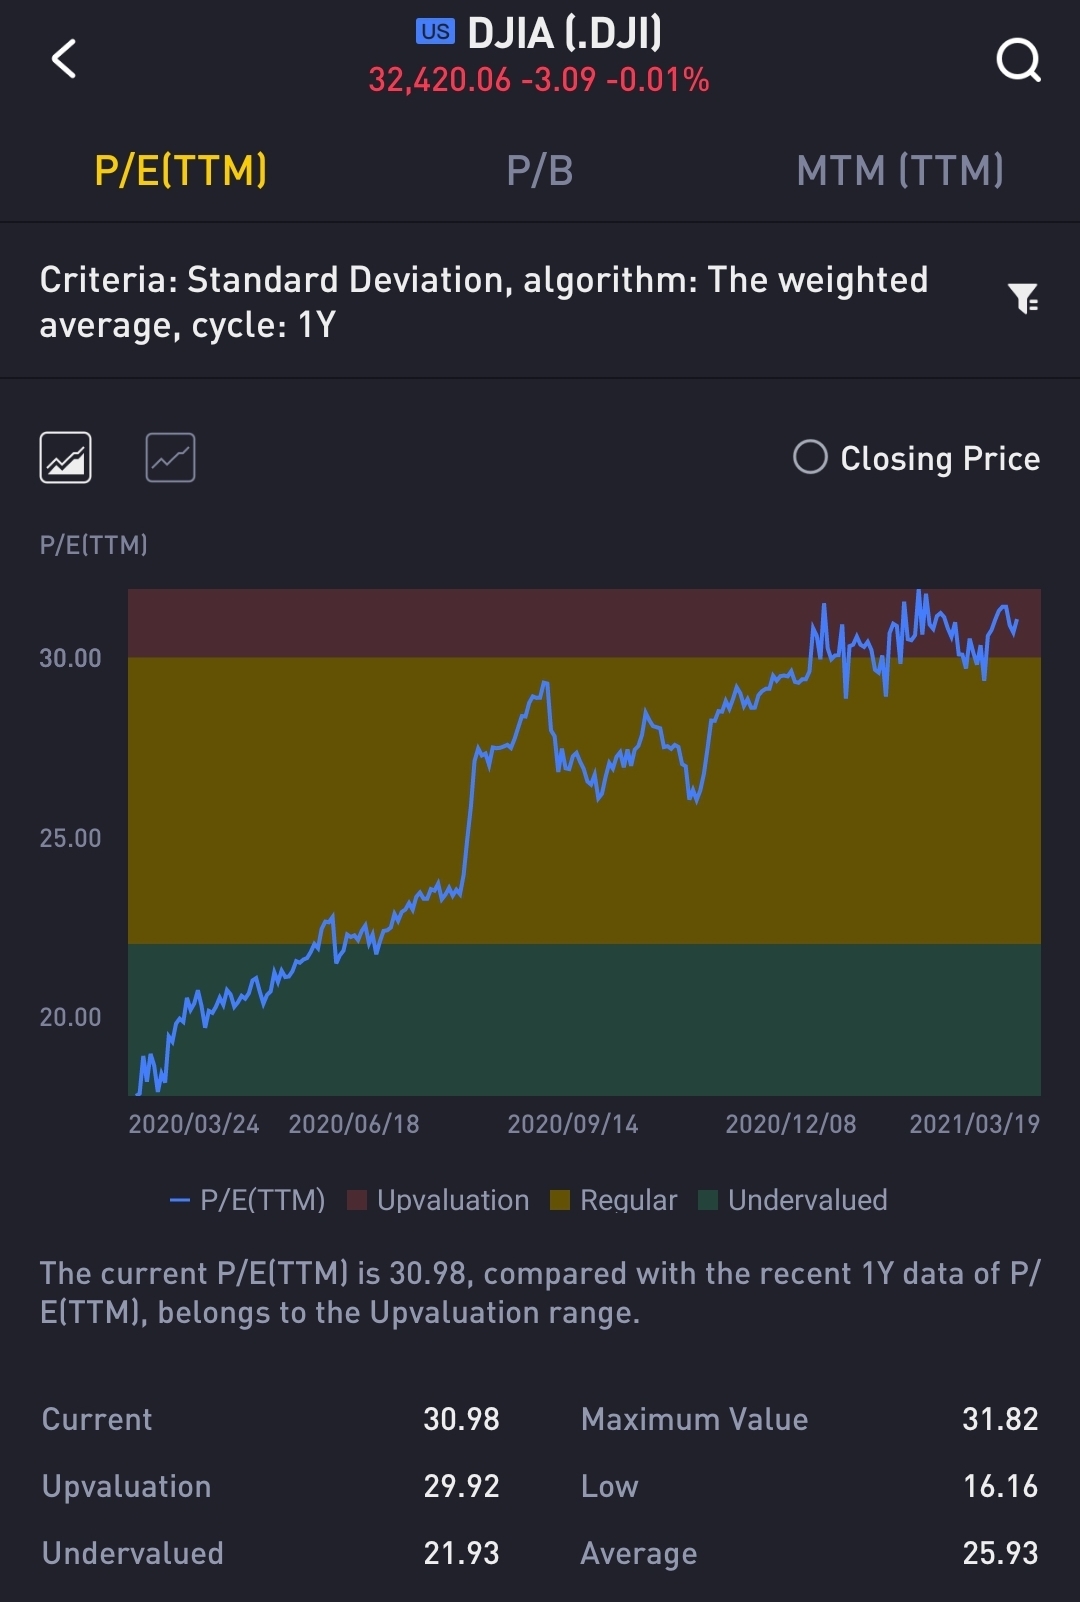
You would notice that the Nasdaq P/E ratio at 38.51 has since pulled back from it high but the Dow Jone's ratio at 30.98 is still climbing. A part of this is due to the sector rotation we are withnessing currently. But are we looking at an over-rotation?
P/E represents the Price to Earnings ratio and Dow being at 30.98, what it means is that the current index is 30.98 times their earnings. How forward looking are investors or am i missing something?
Looking at the charts above, it would also give a good sense of whether the stocks you are interested in is over-valued or not. I.e Apple P/E is at 33.02. Being part of the Dow Jone index, you can say that the P/E ratio is over-valued. *but of course we should take this in its singularity*
Lastly to end off, i saw this chart from CNBC quite interesting.
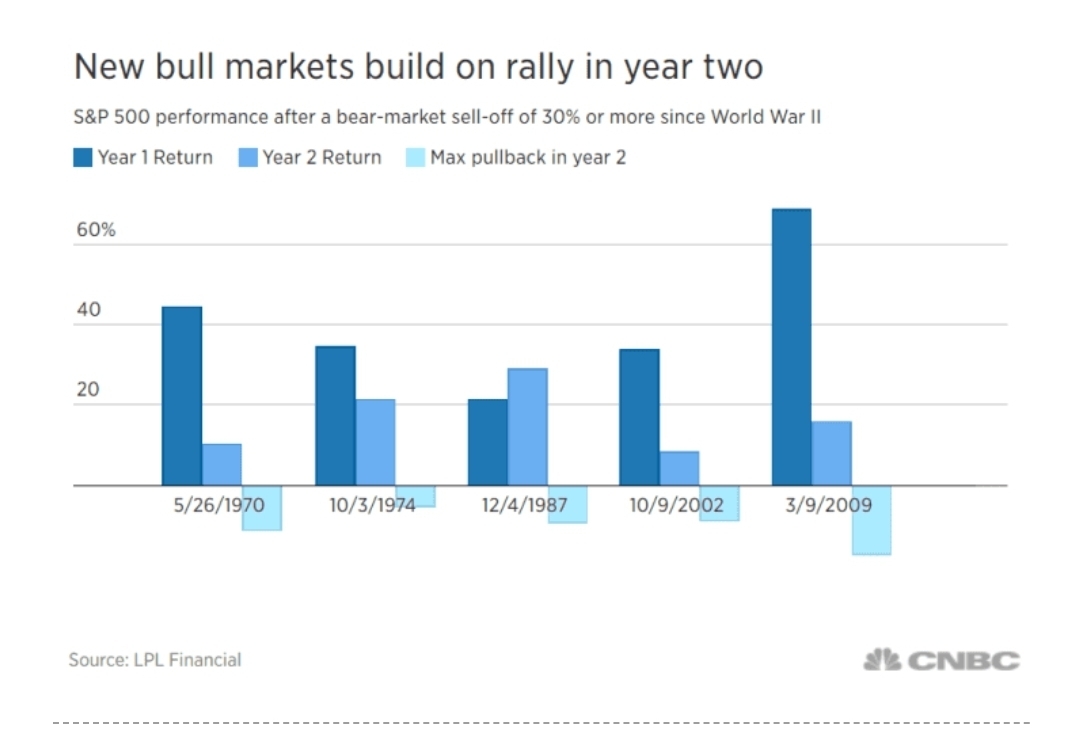
The report by CNBC quoted from historical charts, after every Bull Run in the first year, the 2nd year tend to perfrom not as good and should also expect pullbacks. From the charts it did seem quite accurate (except for 1987). So is this true?
Well, last year 2020 markets saw a bear market during March to April. During the same year, markets also saw a Bull run which brought most markets back to their highs and Nasdaq even hitting its records. This year 2021, aka the 2nd year of bull run according to CNBC, we are seeing some pull backs in the markets. I do not believe that history could predict the future. However, i do contribute this to the behaviour of humans. We as humans tend to follow a historical pattern that repeats itself. Just like in fashion, where trends come and go and come back again, similarly in the stock markets, we human tend to make the same mistakes.
Disclaimer: The above message is solely my opinion and does not constitute as any form of investment advice.
精彩评论